
 April 2018
Updated June 2023
A collaborative publication of the Center for Parent Information and Resources (CPIR) and The Advocacy Institute
This fact sheet is designed to accompany the Stakeholder Guide to the Every Student Succeeds Act (ESSA) and gives you an overview of the statewide accountability system under the Every Student Succeeds Act (ESSA), which must include the following components:
- specific subgroups of students;
- indicators;
- long-term goals and measurements of interim progress;
- annual measurement of achievement (test participation); and
- school identification.
_________________________
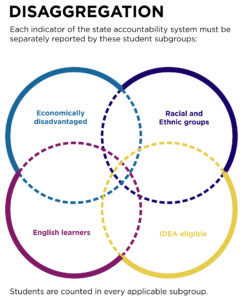
Subgroups of Students
ESSA requires information on each of the accountability system to be broken down into the following identified groups of students:
- Economically disadvantaged students;
- Students from each major racial/ethnic group;
- Children with disabilities as defined under IDEA; and
- English learners.
This breakdown (or disaggregation) brings focus to the performance and expectations of historically low-performing groups of students visible to the public in order to identify any performance gaps. For example, the annual State Data Display produced by the U.S. Department of Education shows information on how students with disabilities are performing on state assessments compared to all students in the state. Explore these data for your state at:
https://www.nationsreportcard.gov/dashboards/achievement_gaps.aspx
_______________________
Graphic View of Required Disaggregation
_________________________
For school accountability purposes, these subgroup data are only used when the number of students in the subgroup meets or exceeds the “minimum” number of students set by the state. This number—also called N-size—varies by state.
_______________________
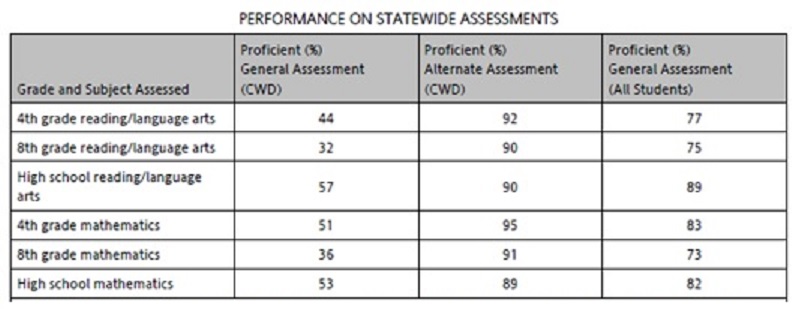
Excerpt of State Data Display 2016
_________________________
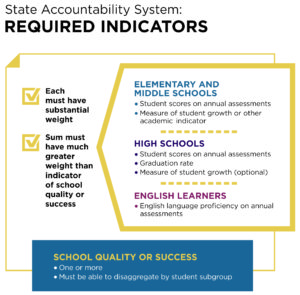
Indicators
The Every Student Succeeds Act requires states’ accountability systems to include a number of indicators of student achievement, in order to hold schools accountable for student performance. Below are the Academic Indicators required by ESSA.
For Elementary and Middle Schools
- Student scores on annual state assessments in reading/language arts and mathematics
- Measure of student growth based on the annual assessments or other academic indicator(s)
For High Schools
- Student scores on annual state assessments in reading/language arts and mathematics (or another nationally recognized high school academic assessment)
- Graduation rate (the four-year adjusted cohort graduation rate and, if applicable, extended year adjusted cohort graduation rate)
- Measure of student growth based on the annual assessments (optional)
For All Schools
- English language proficiency on the state’s annual assessment of English language proficiency
In addition to these Academic Indicators, states must also include one or more School Quality or Student Success indicators, also know as Non-Academic Indicators. Some examples of Non-Academic Indicators might include:
- chronic absenteeism,
- postsecondary readiness,
- advanced coursework completion, and
- school climate.
_________________________
_________________________
Weighting | States must identify the weight it will give each indicator when calculating school performance. ESSA requires that the weighting for academic indicators be much greater than the weight of the indicator(s) of school quality or student success.
_________________________
Long-Term Goals and Measurements of Interim Progress
ESSA requires states to set long-term goals and also measurements of interim progress for each of the academic indicators (described above) for all students and for each student subgroup.
States determine the length of time to reach their goals.
As an example of a state’s long-term goals for proficiency rates in English/language arts (ELA) and mathematics, imagine a chart where the top row (the header row) is labeled, left to right:
- Subgroups
- ELA Starting Point
- ELA Long-Term Goal
- Mathematics Starting Point
- Mathematics Long-Term Goal
The subgroups of students are identified in Column 1 as:
- All students
- Economically disadvantaged students
- Children with disabilities
- English learners
- African-American
- American Indian/Alaska Native
- Asian
- Native Hawaiian/Other Pacific Islander
- Hispanic or Latino
- White
For each of these subgroups, then, the state must specify starting points and long-term goals for both ELA and mathematics. Many states have established a timeline of 12 years for goals to be reached–the number of years a student spends in school.
_________________________
Annual Measurement of Achievement (Test Participation)
ESSA requires that 95% of all students and at least 95% of all student subgroups participate in the state assessments. This important provision makes sure that the test results reflect the vast majority of students and that they reflect the achievement and needs of all students and student subgroups. Without valid information on how students with disabilities are performing on state assessments, schools won’t be able to make sound decisions about their instructional needs. Furthermore, parents won’t have the information they need to determine how the school is doing in serving these students.
_________________________
School Identification
ESSA requires states to use their accountability system to identify schools in need of improvement in two categories:
- Comprehensive support and improvement schools (CSI)
- Targeted support and improvement schools (TSI)
Comprehensive Support and Improvement Schools (CSI)
Schools identified for Comprehensive Support and Improvement consist of those that are:
(a) the lowest-performing 5% of all schools receiving Title I funds;
(b) public high schools failing to graduate one-third or more of their students; and
(c) Title I schools that previously received targeted support and failed to improve.
States must identify this group of schools at least once every 3 years.
Targeted Support and Improvement Schools (TSI)
This group of schools consists of:
(a) Any school with one or more “consistently underperforming” subgroups of students. “Consistently underperforming” is defined by the state, based on all indicators in the statewide accountability system. These schools are identified annually.
(b) Any school in which one or more subgroups of students is performing at or below the performance of all students in the lowest performing schools. These schools are identified at least once every 3 years.
As part of their Annual State Report Card, states must publish the number of schools identified in each of the categories, and also the names of all public schools identified. Local districts must publish the same information for schools within the district in their Annual District Report Cards.
_________________________
Other Fact Sheets on ESSA
CPIR offers additional fact sheets on ESSA that may interest you. They are:
- Academic Assessments and Students With Disabilities
- Assessments for Students with the Most Significant Cognitive Disabilities
- Amendments to IDEA Made by ESSA
- Annual State and Local Report Cards under ESSA
Back to top
_____________________________
Authorship | This guide has been produced in a partnership between the Center for Parent Information and Resources (CPIR) and The Advocacy Institute under the U.S. Department of Education, Office of Special Education Programs No. H328R130014. The views expressed herein do not necessarily represent the positions or policies of the Department of Education. No official endorsement by the U.S. Department of Education of any product, commodity, service, or enterprise mentioned herein is intended or should be inferred. This product is public domain. Authorization to reproduce it in whole or in part is granted. While permission to reprint this material is not necessary, the citation should be: Center for Parent Information and Resources (retrieval date). Amendments made to IDEA by ESSA (ESSA Fact Sheet), Newark, NJ: Author.
______________________________